
Smashed, Still Standing, Soaring: Travel is a Cockroach

What 76 years of crises tell us about travel, capital, valuations and the future
Travel has had a fairly ordinary six years, assuming your definition of ordinary includes a once-in-a-century pandemic, the end of free money, the SaaS valuation massacre, a war in the Gulf and a machine that is coming for your booking funnel.
For public company CEOs, that has meant share prices which often bear only a passing resemblance to operating performance, along with employee share plans that have gone from incentive to decorative wall hanging. For founders, it has meant stale 2021 valuations, reluctant investors and an exit window that appears to open only when nobody is ready to use it.
The obvious question is whether this is unusually awful, or merely travel being travel.
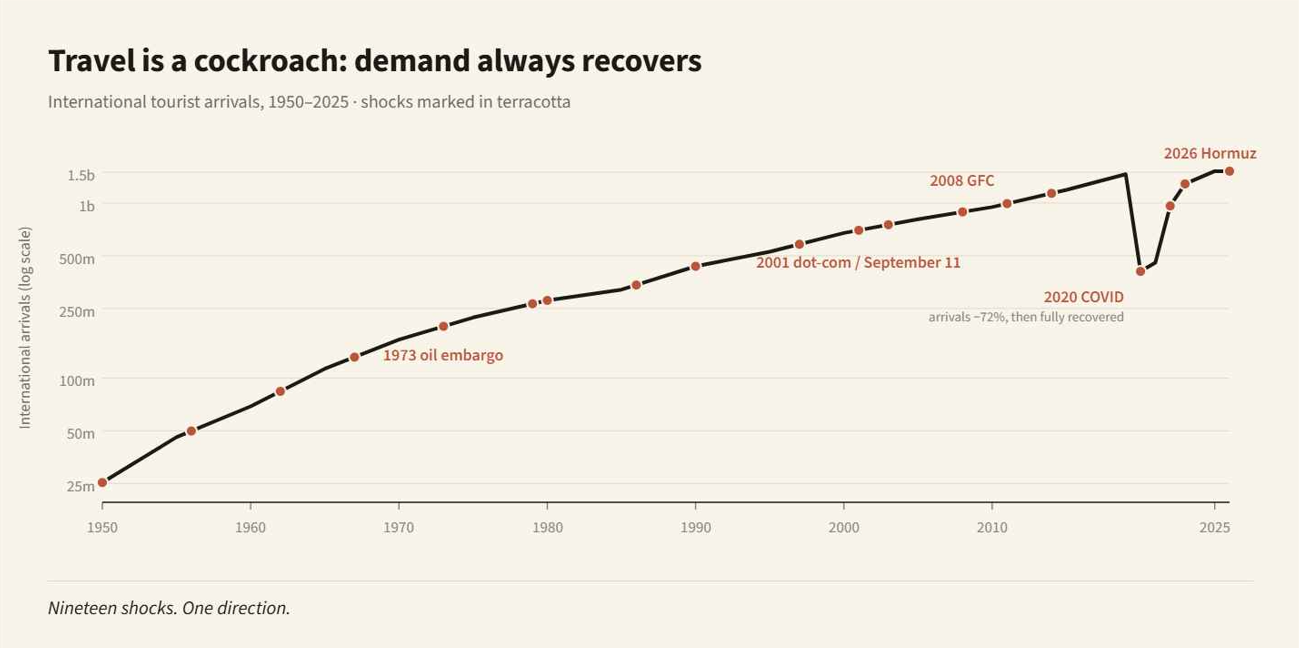
So we went back and checked. Not just COVID or the GFC, but the whole listed history of modern travel: 19 major shocks across 76 years, from Korea and Suez through oil embargoes, terrorism, SARS, recessions, COVID and Hormuz. We then overlaid the capital cycle: venture funding, public raises, IPOs, exits and M&A.
TL;DR
The answer is both comforting and slightly inconvenient - travel demand always comes back, although individual companies quite often do not.
The industry has grown from about 25 million international arrivals in 1950 to a record 1.52 billion in 2025. Demand is the cockroach. It has never failed to grow across a full decade.
The four forces that constantly disrupt the travel sector are war, pandemics, economic shocks and new technologies.
76 years of data shows the cohort of listed travel companies has turned over almost completely. Capital structure, business model, access to funding and strategic relevance will determine your fate.
Most event shocks repair quickly. At least 14 shocks recovered within about a year. Sustained damage comes from fuel, credit, liquidity or demand, and certainly from a severe pandemic - but not from frightening headlines alone.
Online travel is insulated from fuel and physical assets, but it's exposed to interest rates and technological migration. The sector’s 2026 crash, up to 60% for the hardest-hit small caps, is far worse than the fall experienced by the physical travel stocks, but still milder than 2008, 2020 or 2022.
The market is probably overreacting to near-term earnings risk from Hormuz, while correctly questioning who owns the AI booking path. Demand owners, proprietary supply, trusted payments and embedded infrastructure should fare better than thin interfaces.
Capital follows share prices with a lag: after public valuations fall, private funding tightens, the IPO market shuts and M&A accelerates. Expect a wave of mid-market M&A: the pressure is now firmly on the near-break-even VC-funded Travel Tech companies carrying 2021 valuations but lacking the capital to scale.
Our base case trough-to-peak share price recovery timeline is 9-18 months for scaled, profitable platforms and 18-36 months for smaller peers. AI is the potentially existential wild card that will hold some back from recovering at all.
And don’t forget the huge upside from buying these stocks when they’re on their knees. With the caveat that Hormuz and AI are, as yet, far from resolved.
Crisis? What crisis?
Travel shares usually fall harder than the market in a crisis, then recover more consistently than the mood at the bottom suggests.
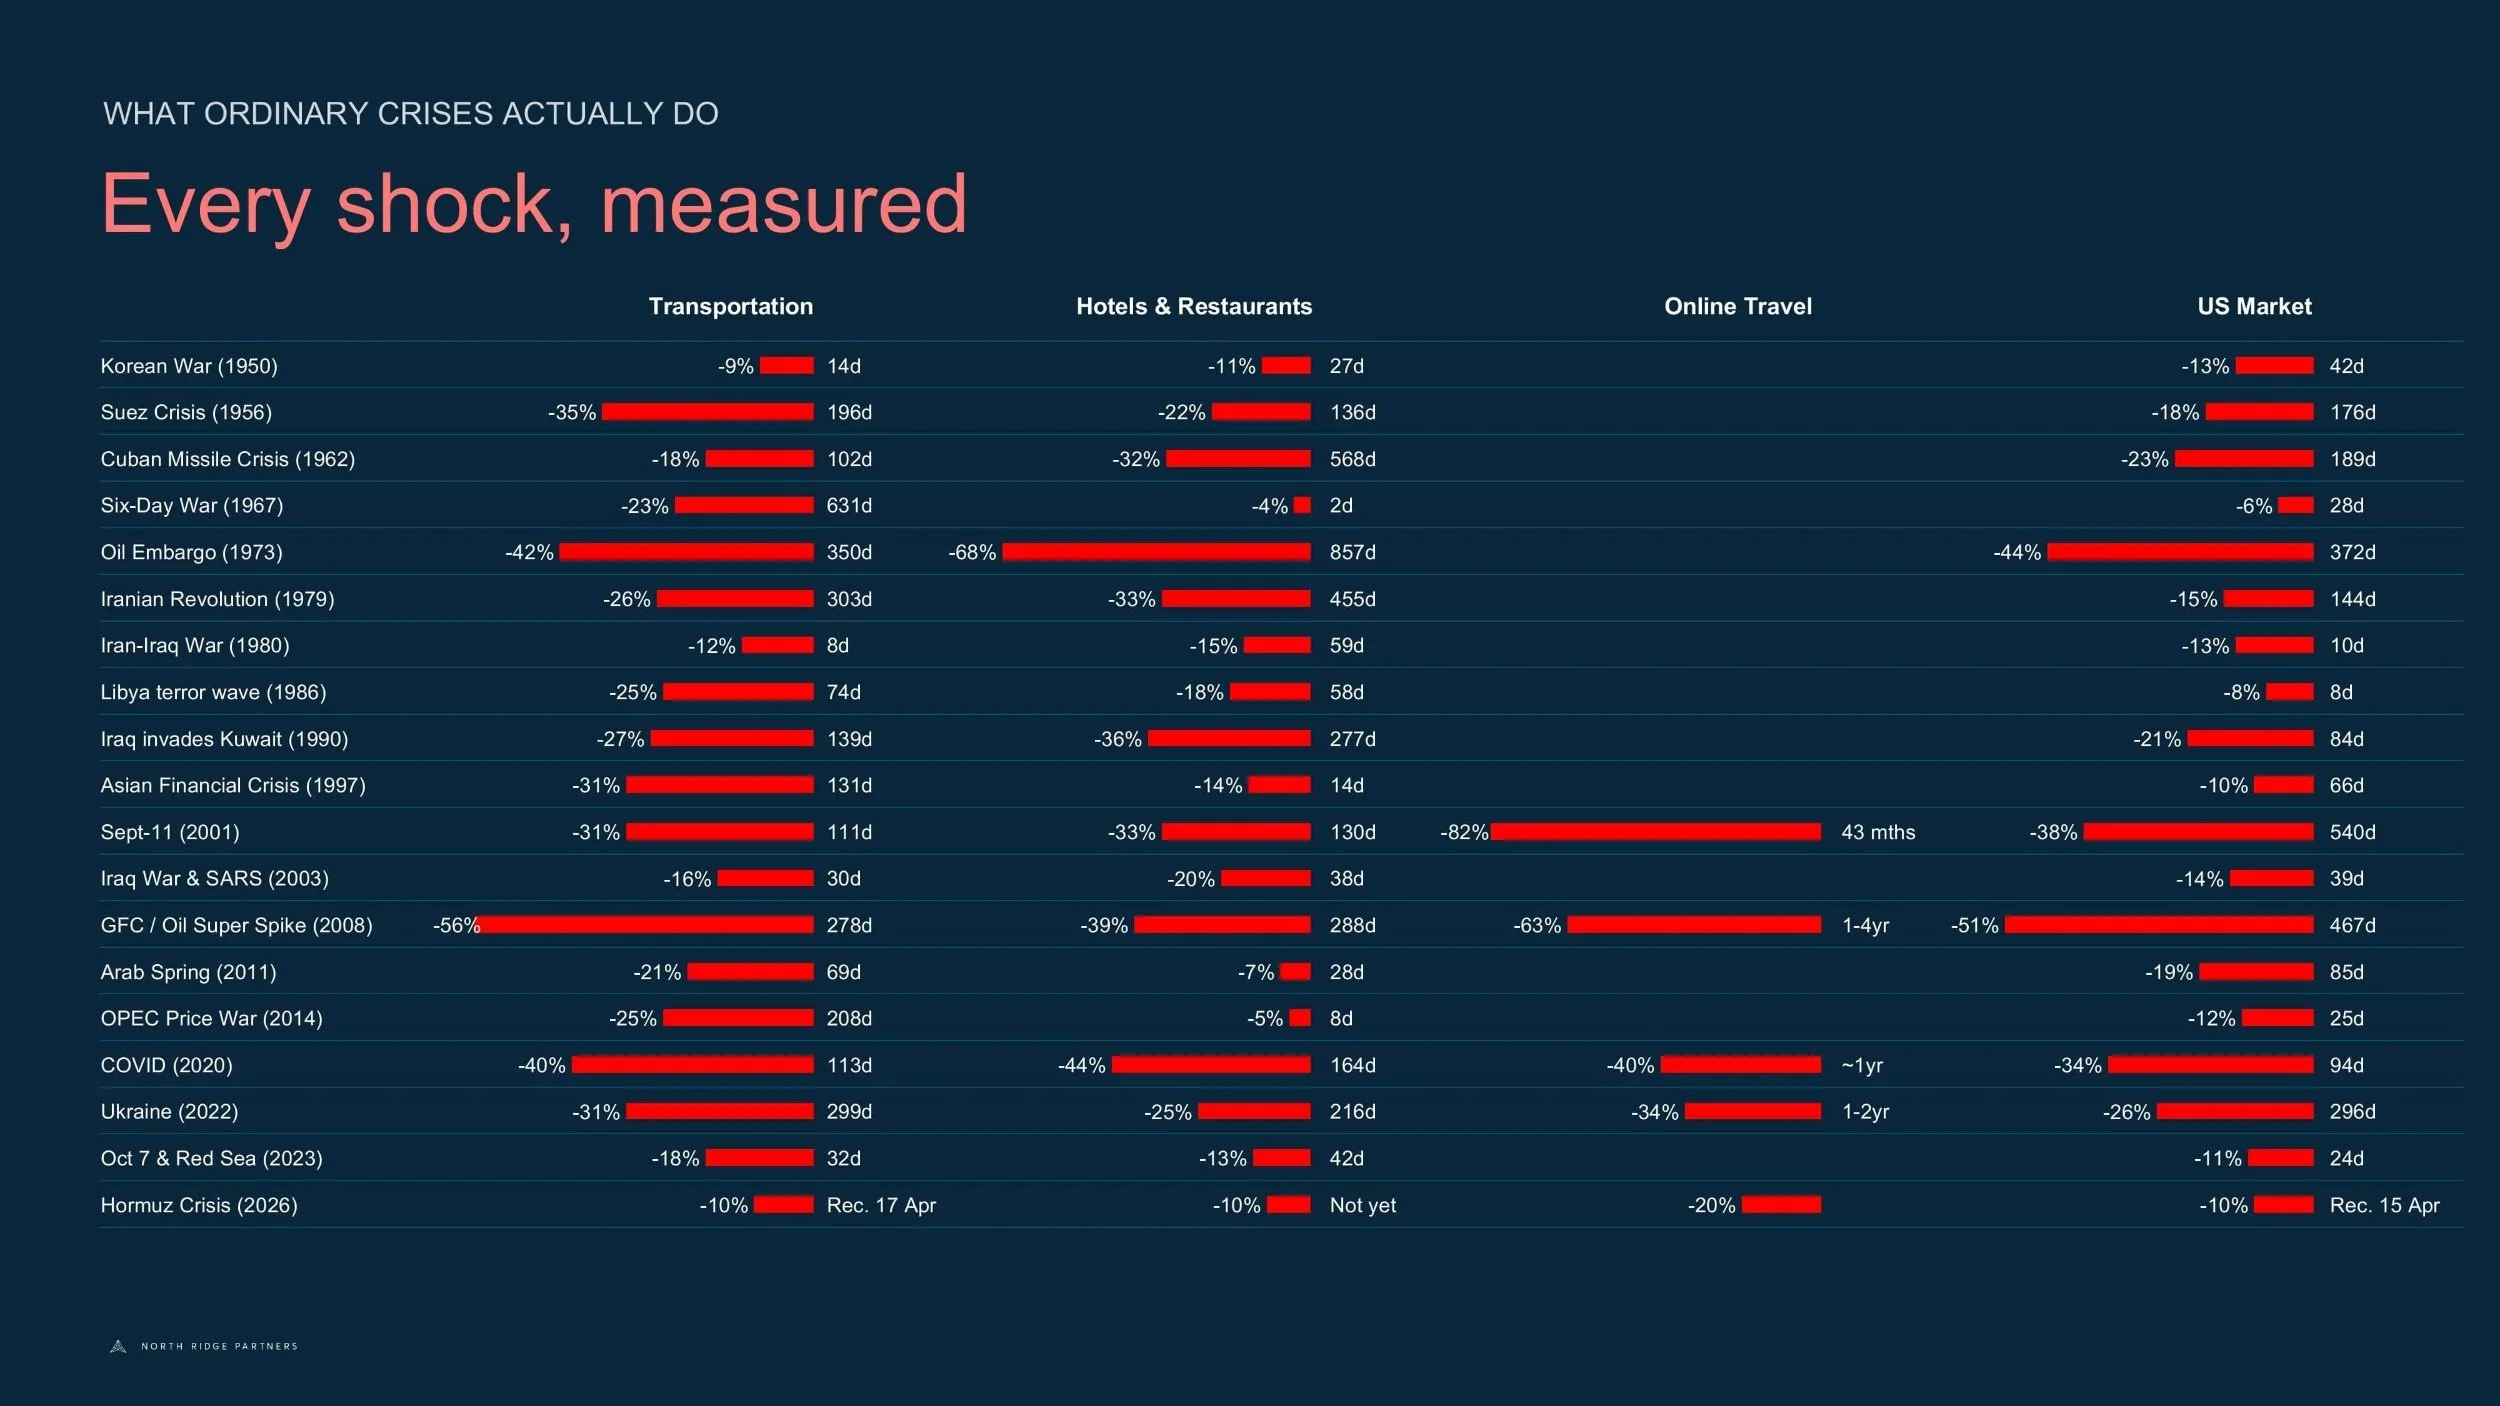
What matters is whether the shock changes the economics for long enough to count. The 1973 embargo, the 2008 oil and credit crisis, and COVID damaged demand. Pure fear passed quickly: the Six-Day War cost hotel share prices only 4% over two trading days, and October 7 was repaired inside two months. But the 1973 oil embargo was much, much bigger, cutting airline shares by 42% and hotels by 67%, with hotels taking 857 trading days to recover.
Hence the useful rule: fuel kills, but fear only bruises. The index is not your company. It recovers because survivors typically grow and outweigh failures by a significant factor. Smaller companies did much worse in 2008 and COVID suggesting that scale, liquidity and access to capital are your friend in a crisis.
Online travel is different, until it isn’t
Online travel is the youngest cohort: Priceline (now Booking) and Expedia listed in 1999, Ctrip in 2003, and the investable sector only became broad in the 2010s.
Common garden travel scares barely register because online travel owns no fuel and few physical assets. Its wounds come from the cost of capital, a collapse in demand, excessive leverage or fear that a new interface removes its place in the transaction.
The deep falls were 2008, 2020 and 2022. The GFC cut the cohort by roughly 60%. The index clawed most of that back within a year, dragged up by Priceline tripling off the bottom, but laggards like Expedia, down 76%, took two to four years - a reminder that the index is not the median company. COVID cut the cohort by about half, however strong survivors regained their highs in about a year, while debt-laden Sabre fell more than 80% and never really returned.
In 2022, Travel Tech shares collapsed again during a travel boom. Booking fell ~40%, Airbnb ~50% and Expedia ~60% as the end of zero rates repriced growth assets. The disruption proved that a Travel Tech business and its share price can travel in opposite directions for quite a while!
Travel Tech’s failure mode is also different. Airlines such as Pan Am went to zero whereas Wotif, Orbitz, Kayak, Qunar, Despegar, Travelocity and eLong mostly left the publicly traded cohort when they were sold.
In online travel, it appears that delisting has more often meant a cheque than a stretcher.
Follow the money
Your investor dollar has done more travelling than you have these past six years, and enjoyed it considerably less.
In the public markets, COVID separated survival capital from growth capital. In April 2020, with travel closed and no vaccines in sight, Webjet raised a deeply discounted A$346 million in survival capital to fund itself through the pandemic, followed by a convertible note. Amadeus raised €750 million of equity and €750 million of convertibles; Airbnb later raised US$3.4 billion in its December 2020 IPO. In 2021, by the time SiteMinder completed its A$627 million IPO, quality control had briefly gone on sabbatical as SPACs proliferated on Wall Street. Public valuations subsequently collapsed in 2022.
Meanwhile, in the private markets Travel Tech startup funding rose to US$16.3 billion in 2021 and to US$11.7 billion in 2022, only to fall to US$5.3 billion in 2023 and US$5.8 billion in 2024. Through Q3 2025, only US$3.5 billion was raised across 161 rounds, versus roughly a thousand rounds a decade earlier.
Travel Tech M&A, meanwhile, reached a reported record count in 2024 and more than 40 deals in one three-month period in 2025. Capital changed sides of the table.
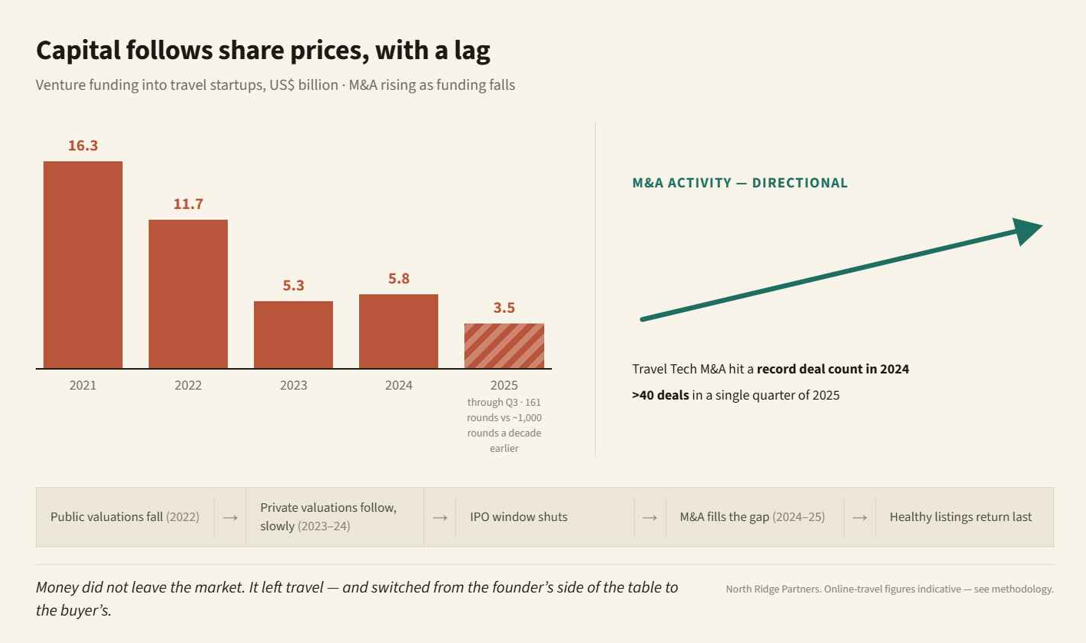
What does all of this mean? The answer is that the market moves in series, not in parallel. Public markets go first: in 2021, with the IPO window wide open and valuations rich, private rounds priced up to match which delivered a US$16.3 billion funding peak. When public prices broke in 2022, the IPO window shut almost overnight, but private valuations came down slowly, because founders and their backers resist down rounds. The private funding drought lagged by about a year, landing in 2023-24. With listings closed and growth capital scarce, M&A becomes the release valve - and it moves last, only once sellers accept the lower prices buyers are offering, which we started to see in 2024 and 2025. The IPO window for Travel Tech probably reopens last of all, in this case once public valuations steady and when AI is seen to expand profits rather, than erode them.
Today’s funding barbell
Capital is still flowing, but the pattern resembles a barbell with disciplined seed and Series A cheques sitting at one end, and large rounds for proven scale, increasingly wearing an AI badge, sitting at the other.
For example, at the larger end of town Mews raised US$300 million at a US$2.5 billion valuation in 2025, TravelPerk US$200 million at US$2.7 billion in 2026, as Stay22 took in US$122 million, largely as a secondary.
Startup funding appears buoyant but there’s a cautionary note: global venture funding may appear to have gone up sharply in recent years, but AI is absorbing most of it - as much as 80% in Q1 2026. Still, earlier stage Travel Tech businesses are still successfully raising. Closer to home Sydney-based travel payments fintech Slice/PayLater Travel raised A$7.5 million in 2024. Queenstown-based hospitality tech company First Table raised NZ$4 million in 2025 and is now in the market again. Altered Capital just co-led a NZ$7.5 million Series A into Auckland-based aviation-compliance platform OneReg.
The difficult bit is the middle: many companies that raised at 2021 valuations have reached or approached break-even, but now lack the cash to scale. They are too mature for seed, too small or slow for growth funds, and too highly valued to raise cleanly. Many are sound businesses; they are simply overvalued and undercapitalised. Their options are a down round, recapitalisation, sale, roll-up, austere self-funded growth or wind-down. The market can recover before a cap table does; break-even is not funding for the next leg. For this cohort, M&A is increasingly the financing solution.
Hormuz and AI
These two shocks landed together, but were very different. Hormuz raised the cost of physical travel. AI reduced the valuation placed on parts of the booking chain.
Planes, Trains and Automobiles: the physical travel world
Jet fuel almost doubled between February and April. US transportation shares, with route structures less impacted than their European and Asia Pacific peers, fell ~10% from peak to trough and regained their previous highs within two months. European airlines generally fell 10-20% and recovered most or all of the decline within three to four months.
Asia-Pacific was hit harder. Qantas fell about 34% from peak to trough and had recovered roughly two-thirds of the decline by early July, leaving it about 18% below peak. Air New Zealand fell close to 30% and hasn’t recovered.
Cruise shares also fell as fuel and itinerary costs rose. Carnival declined ~19%, Norwegian 18% and Royal Caribbean 11% during the initial shock. They subsequently rose 6–7% in a single session when the outlook for Hormuz improved, although Norwegian remained ~30% below its 52-week high in early July.
Listed hotels fell about 10% from peak to trough and recovered most of the decline within several months. Car rentals were mixed. Sixt fell about 7% and recovered within three months. Hertz remained deeply depressed for balance sheet reasons. Avis briefly rose more than 450% in a short squeeze, then fell about 75%. In short, there was no clean sector-wide Hormuz pattern.
Global OTAs
Online travel fell much further: about 20% value-weighted, 30% equal-weighted and roughly 45% at the median. Airbnb fell about 7%, while some smaller companies declined 60% or more. Recovery remained incomplete in July.
Booking reported Q1 bookings and revenue growth of about 15%. Expedia reported bookings up 13%, revenue up 15% and B2B revenue up 25%. Expedia recovered to within approximately 11% of its 52-week high, while Booking remained materially below its January peak.
B2B hotel distribution
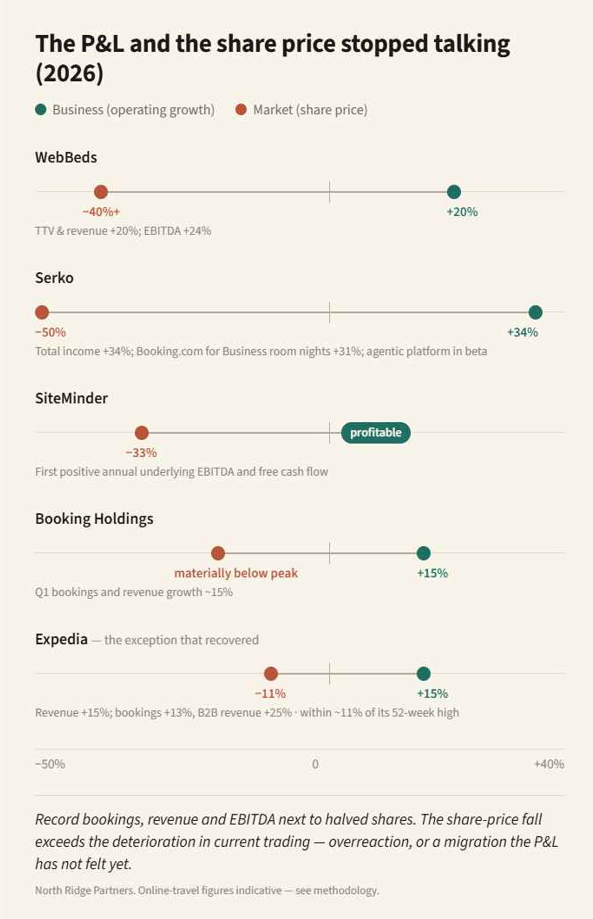
WebBeds’ parent fell more than 40% despite FY26 TTV and revenue increasing 20% and EBITDA increasing 24%. HBX has fallen about 50%, from its IPO price, including around 14% this year. TBO Tek fell about 40%, from roughly ₹1,765 to ₹1,000, before partially recovering.
Travel Tech
Serko fell about 50%, although total income increased 34%. SiteMinder fell roughly one-third despite reporting its first positive annual underlying EBITDA and free cash flow.
The divide
The gap between operating performance and equity value suggests overreaction, but does not prove it. Markets may be discounting lower take rates, weaker customer ownership, higher acquisition costs, direct supplier access through AI agents or eroding software toll gates. Record revenue can coincide with the start of a structural migration. History has played that joke before.
Extinction event or market tantrum?
Probably neither. The market is overestimating near-term earnings damage while correctly identifying a long-term strategic risk. Markets are quite capable of both at once: it is one of their more expensive talents.
Current large cap share price declines are below the 50-70% declines of 2008, 2020 and 2022, and nowhere near Priceline’s 99% dot-com collapse: severe, yes; unprecedented, no.
Meanwhile, demand, bookings and revenue are still growing. Travel demand is a cockroach! The largest OTAs retain formidable demand liquidity, loyalty, data, payments, supplier connections and marketing scale. AI agents may route through them, particularly for complex and serviced transactions. B2B distributors and hotel software also sit inside contracting, inventory, payments and servicing workflows that a conversational interface does not magically recreate.
AI can shift discovery away from websites and apps. If AI platforms control intent before the traveller reaches a travel company, they gain leverage over commissions, payments and customer ownership. Metasearch, generic middleware and other thin layers are exposed where they own neither proprietary inventory nor the traveller.
Technology shocks do not end with every incumbent regaining its old multiple; value moves to whoever adapts fastest. This is not an extinction event for online travel, but it may be one for parts of the old interface. Scaled demand owners, proprietary supply, trusted payments and indispensable infrastructure should survive; commodity connectors may be bypassed, bought or permanently repriced.
The market is too pessimistic if it assumes the whole cohort loses its earnings power. It is rational to demand proof, company by company, of who still owns a toll gate.
When does this end?
CEOs are asking when share plans will stop looking ridiculous, founders are wondering when buyers will return, and investors want to know when falling knives become cutlery. The data gives a range, not a date.
The sharp valuation cuts of 2026 imply, using the long-run relationship between peak to trough and trough to peak that recovery will take between nine months and two and a half years. Online travel precedents tell us that strong COVID survivors recovered in about a year; the 2022 repricing took around two years for large caps and remains unfinished for many smaller names; the GFC took two to four years.
What to do while waiting
Decide whether you have a share-price problem or a business-model problem. Put simply, a lower multiple on a growing company can recover, but a disappearing role in the booking path cannot.
Private companies need to stop anchoring their valuation expectations on 2021. Zerp is not coming back any time soon! Public comparables set the price, and near break-even does not fund global expansion or an AI rebuild. Build liquidity early and confront the funding gap before the runway does it for you.
For investors and acquirers, the opportunity is in sound businesses with real customers, caught between an outdated valuation and a missing growth round. What you buy at the trough can compound; what you buy at the top, you service.
And remember: event shocks are survived by design. Technology shocks are survived by choice.
Don’t forget the recovery
If we’ve learned one thing from 76 years of data, it’s that the sector recovers very quickly, almost always within a year.
The math reveals the opportunity: a ~45% fall (the 2026 median) needs an 82% recovery just to reclaim its high. History says quality gets there fast - GFC survivors recovered most of a 57% drop within a year (Priceline tripled off the bottom), and COVID's strongest names regained their highs in about twelve months.
The base case is 9-18 months for scaled profitable platforms. The weak never return, so the alpha is in buying quality, not the index.
The 2026 setup is textbook: if you can navigate the AI and Hormuz risk, you're being paid to buy growth at a discount. If we’re near the trough, history would point to roughly a double back to prior highs over 12-24 months. But two caveats mean that isn’t yet a green light: Hormuz is unresolved, and AI makes this the first cycle where defensibility, not just cheapness, decides what's worth buying.
The verdict
Travel demand is remarkably difficult to kill. Travel tech companies, by contrast, can be killed - especially if they’re disrupted by new technologies or run out of money in a crisis.
The 2026 sell-off is worse for online travel than for physical travel, but not worse than its major historic downturns. Strong operating results support the overreaction case; uncertainty over the AI booking path rules out complacency.
The likely outcome is a sorting, not extinction or a painless rebound. Scaled platforms and indispensable infrastructure should adapt; differentiated startups will still be funded; some smaller interfaces will be acquired or recapitalised. Demand may return to a booking path others no longer own.
Travel remains the ultimate cockroach. In a technology migration, however, survival is chosen early, funded properly and demonstrated in the numbers.
Roger Sharp (with a little help from the machines coming for your booking funnel)
Footnote on methodology
The transport, hotel and US-market data use survivorship-free CRSP industry portfolios, including dividends. Online travel uses a computed study of the listed cohort from S&P Capital IQ month-end data (29 listed names plus the eight delisted names whose price history survives). Because the data is monthly, the depths are a touch shallower than the true daily lows; and because five long-dead names could not be recovered - including the only two outright bankruptcies - the cohort is very slightly flattered. Early results (built on only a handful of names) and recovery times remain approximate.
Recovery estimates draw on the size of past falls, online-travel experience in 2008, 2020 and 2022, current trading and the usual lag between public markets, private funding, M&A and IPOs. The clock starts at the confirmed trough, and some companies may never regain former highs.
Like this article? Join the thousands of tech founders, board members and investors who subscribe to our free monthly newsletter, Tech Round-Up. Sign up below!