
Follow the Money
Our first article showed how irrepressible and unbreakable travel is – even the face of the most intractable circumstances. But what of the money that flows into travel investments – how much has gone in, how much has come out, and what happens next?
Over the last four years, we have had, give or take, two full years where most of the world was preoccupied dealing with a pandemic for which there was no real rule book. This clearly had unprecedented effects on travel. Then followed a further two years of “post-pandemic” trading, which coincided with a crash in the Tech sector. Inferring too much from the data from these years is challenging, but we gamely set our analysts to work...
To build out the picture, we have done a deep dive into PitchBook’s private capital raise data for the travel sector (both travel tech and travel industry) across Asia-Pacific - and we’ve also looked at equity raises completed by publicly traded travel companies. We’ve covered eight years - the four years pre-COVID, the two years during, and two years since.
We restricted our data set to transactions over US$20 million, trying to see whether we could draw some conclusions about future deal activity based on the investments made before, during and after the pandemic.
Our analysis broke down travel sector capital raisings into different categories, eliminating transactions that don’t accurately reflect the amount of new money going into the sector. We:
split up travel tech, travel distribution and travel products (like hospitality, accommodation, airlines and airports);
broke down deals by venture capital, private equity and public market capital raisings;
removed secondary sales of equity (i.e. where new money was not raised); and
broke down corporate deals where significant stakes were acquired by travel industry participants [1]
[1] These deals are interesting to track (e.g. the swap of holdings in MakeMyTrip by Naspers and Trip.com), but we assume that such strategic investments are likely to be more permanent, and are less likely to impact future deal activity.
Finally, to see if we could establish any trend lines, we looked at the exits that financial sponsors have achieved over the past eight years.
Total Travel Capital Raisings, Asia-Pacific
Over the four pre-pandemic years, total travel capital raisings grew at a CAGR of 36%, then declined by a significant 38% in 2020. The capital injected into the industry quickly recovered in the subsequent two years – with more than US$26 billion raised in 2022 alone, when balance sheets needed to be repaired, underscoring investors’ belief in the strength of the travel industry.

Shifting the lens to private and public capital raising deals, we can observe that public capital contributions declined from an average of 25% yearly pre-Covid and during Covid to less than 5% post-Covid. As with many industries, the private market has become the dominant source of capital in travel. Alternatively, it is possible that the publicly traded companies raised enough money and don’t need any more for now or are waiting for market conditions to improve.
We also observe that a significant amount of capital was invested both in the four years leading up to Covid (US$16 billion), and during the pandemic (US$20 billion), which will be looking to exit - assuming it has generated value. That will be more difficult for investments made at pre-pandemic pricing.
Travel Tech Equity Raisings, Asia-Pacific

COVID shifted capital allocation from travel tech to travel industry deals. Travel industry deals averaged 60% before pandemic, and rose to ~90% yearly after the pandemic. A few conclusions can be made here.
First, the higher travel industry capital raised indicates that traditional travel businesses such as airlines, airports and hotels were seen as good long term industries, notwithstanding some short term pain – investors clearly shared our belief that travel is unbreakable. Second, the concentration of investment in the travel industry suggests that investors were prioritizing immediate recovery and cash flow over long-term technology-driven solutions.
However, travel tech still delivered plenty of interesting and sizeable transactions - the 20 largest deals over the period raised a cumulative US$13.6 billion, with 55% coming from corporate investors, and 35% from financial sponsors.
A handful of companies were responsible for meaningful proportions of the total capital raised, with the top 10 fundraising companies raising nearly US$14 billion from 26 transactions, or 83% of the total raised (much of it when Qunar was taken private). These key players are shown in the following table.

Of the nearly $14 billion which these ten largest players accounted for, nearly half involves two corporate situations – the acquisition of Qunar and the swap of the Naspers and Trip shareholdings in MakeMyTrip. The $550m PIPE investment by HNA into Tuniu in China and Agoda / Booking’s investment in Yanolja were also significant deals. Apart from that, however, the rest of the raisings were large, serial issuers from China, Indonesia, Hong Kong, Korea and Australia.
Deal Velocity
The large deals and the most prolific raisers don’t always tell the full story. In our eight year period, there were 81 travel tech transactions, or 73 if you exclude the corporate transactions. That’s one every month if you exclude Christmas, Chinese New Year and Ramadan.
Excluding the largest raisers there were 55 transactions across the 8 years, with an average deal size of US$68m (note we excluded the smallest deals, less than US$20m, which would have resulted in a significant increase in the number of deals and a reduction in deal average).
Sector Exits
If there’s anything to make an investment banker’s pulse race quicker than a good sized capital raising, it’s a good sized M&A opportunity. We are optimistic that there will be plenty to keep us busy over the next few years in the APAC region. We don’t only base this view on the investment record above, but also on the track record of exits over the last few years.
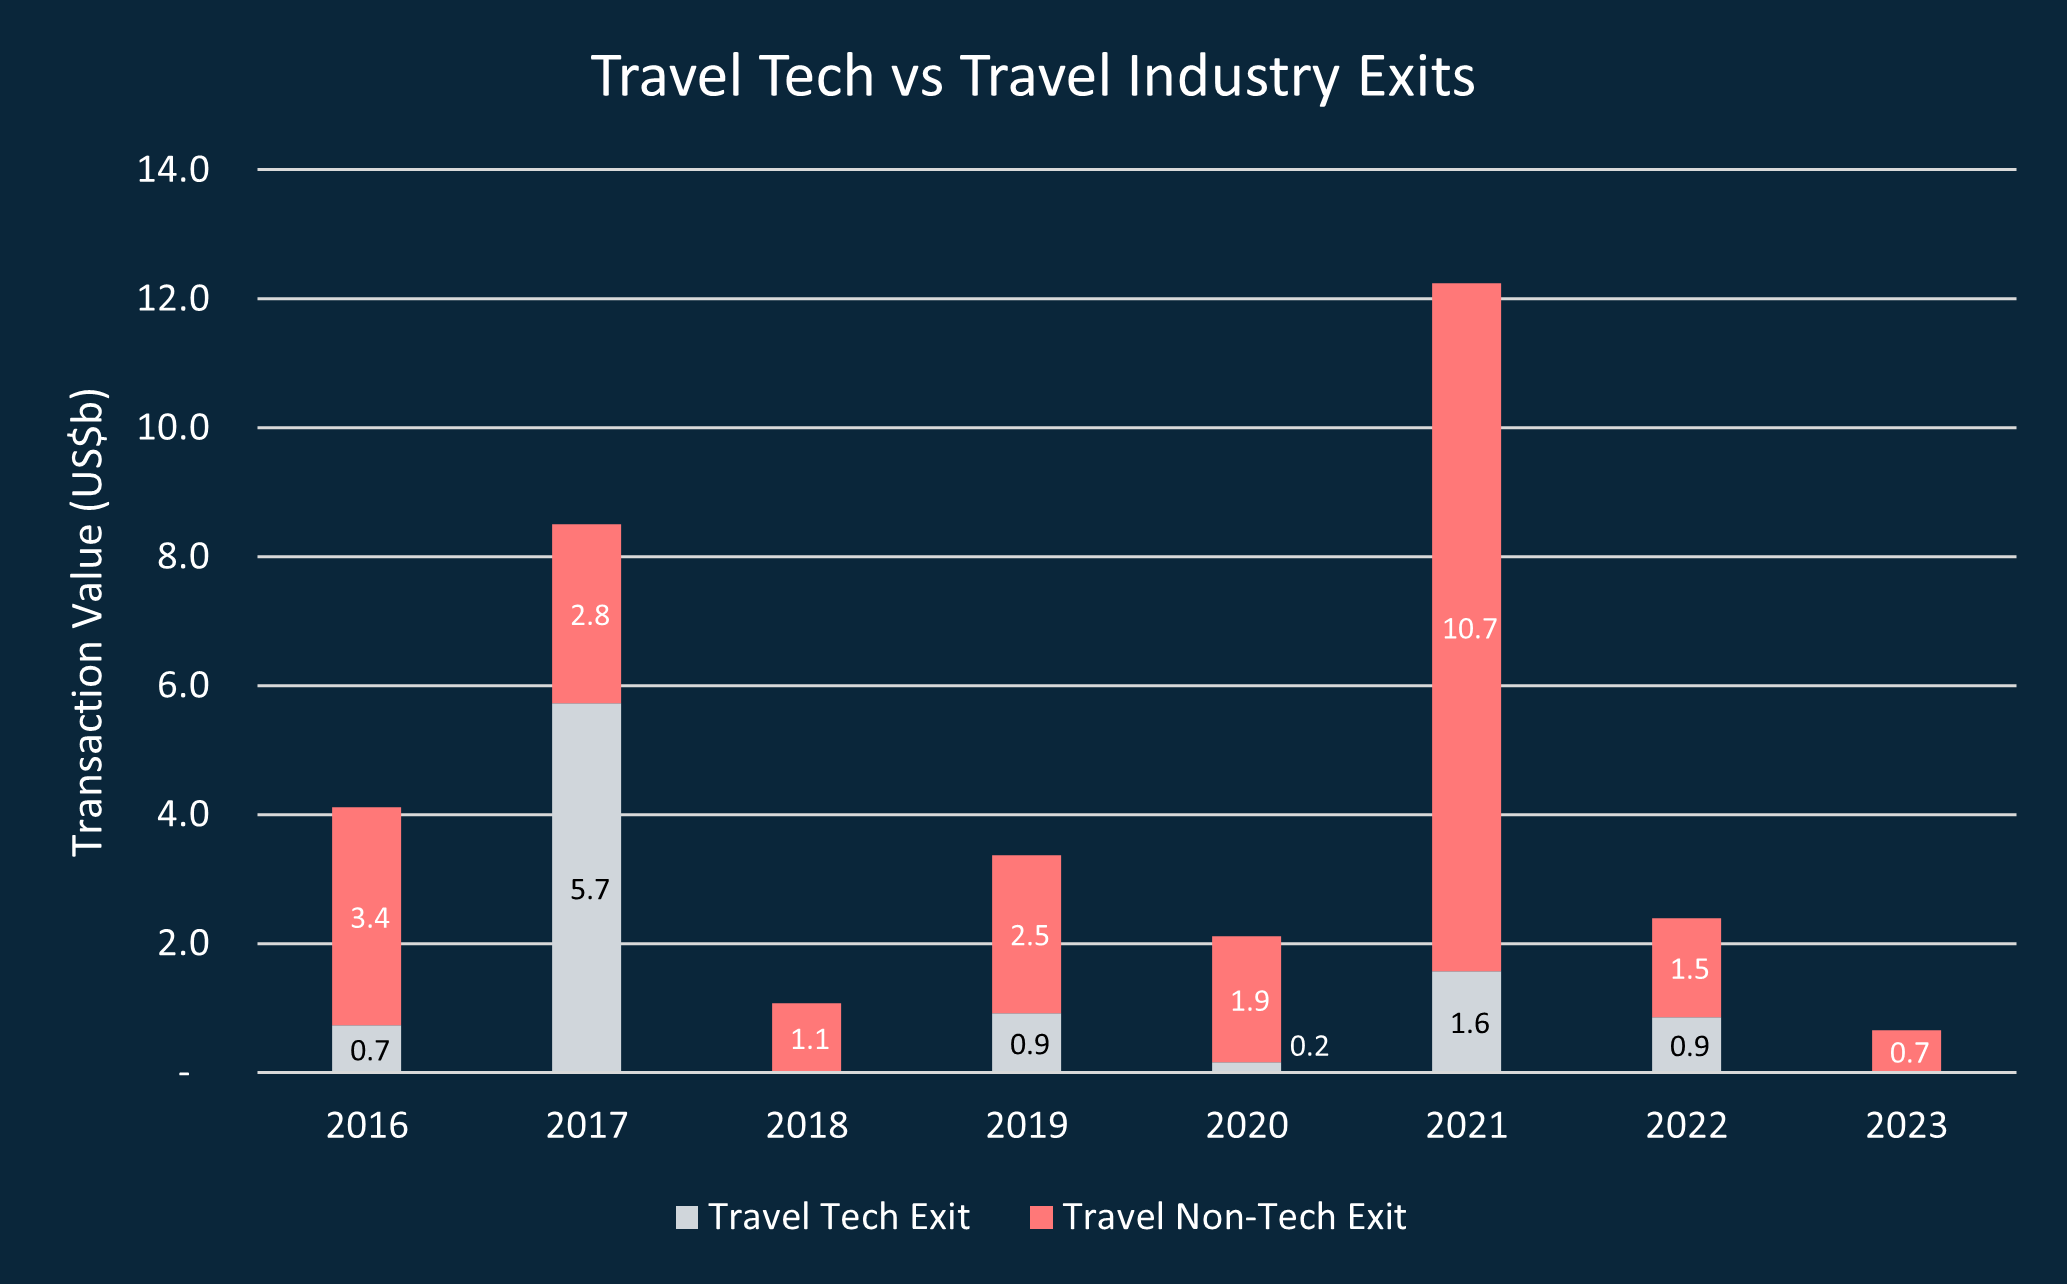
The chart above depicts the exits of travel tech and travel industry investments across the full 8 years - the impact of outlier years (2020 - Covid) and 2022-2023 (Tech downturn) can be seen clearly; conversely, despite 2021 being a Covid year, it was also the year where the tech “bubble” was at peak velocity, fueled by cheap capital.
The other stark conclusion is that travel industry exits outweigh travel tech exits significantly, with 79% of all exits being from the travel industry. There were only 18 travel tech exits during the 8 years - and 7 of those date from 2016 and 2017, so are likely to have resulted from investments made before our time period. There have been only 9 exits since Covid started.
Given the imbalance between capital inflows and exits achieved, many investors will be looking to recycle their capital over the next few years. The industry is already seeing this in the EU and USA where sponsor-backed online travel platforms are either on the block or are rumoured to be for sale. The same will happen in Asia-Pacific.
Bring it on, we say!